

Excel Beyond Basics- Spreadsheet aficionados! Are you ready to take your Excel expertise to the next level? In this guide, we won’t just scratch the surface; we’ll dive deep into five advanced Excel functions that will revolutionize the way you handle data. Whether you’re a business professional, a student, or simply someone keen on mastering Excel, these functions are your gateway to unparalleled efficiency. So, buckle up and let’s unravel the secrets of Excel mastery!
Introduction: Excel Beyond Basics
Excel, the powerhouse of data management, offers functions that go beyond the ordinary. As you delve into this guide, you’re embarking on a journey to explore advanced functions that can tackle complex tasks with finesse. These functions aren’t just tools; they’re strategies that empower you to manipulate data, visualize patterns, and extract insights like never before.
COUNTIF – Count with Precision –Excel Beyond Basics
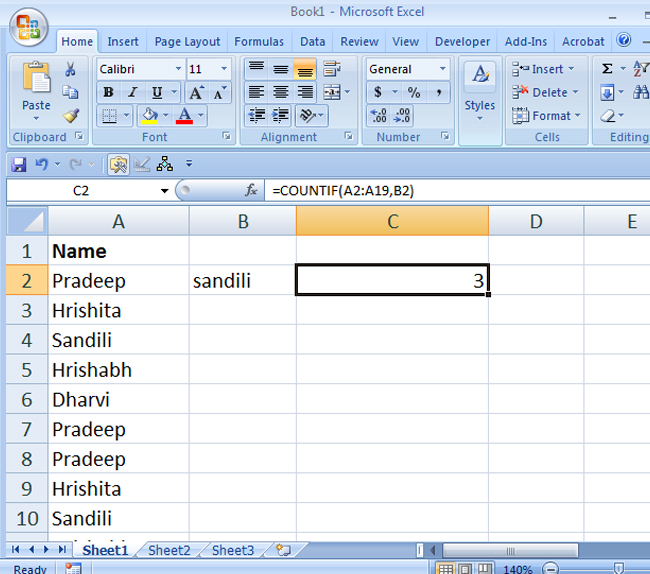
COUNTIF is your ticket to precise data counting. It’s not just about numbers; it’s about strategic counting. Whether you’re tallying specific entries in a vast database or tracking unique occurrences, COUNTIF gives you the accuracy you need.
Example: Imagine a column (A2:A100) with student’s name in school. To count the occurrences of “sandili” the formula would be:
=COUNTIF(A2:A100, "sandili")
. Excel calculates and displays the exact count.
SUMIF & SUMIFS – Advanced Summation Excel Beyond Basics
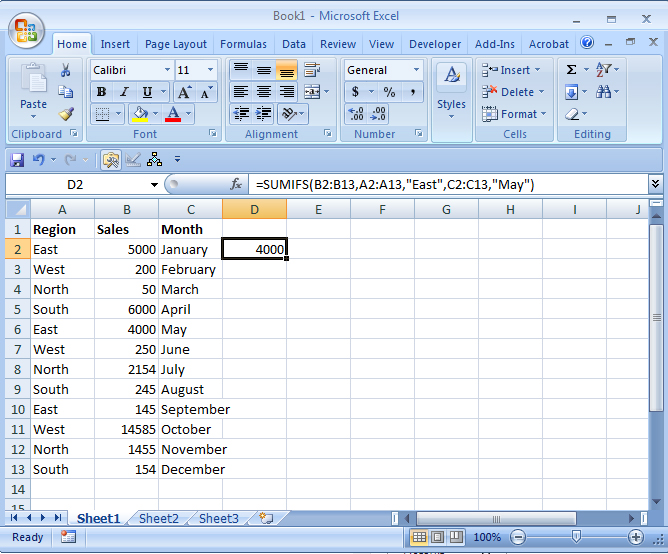
SUMIF and SUMIFS are your companions for nuanced summations. While SUMIF adds up numbers based on a single condition, SUMIFS takes it a step further, allowing you to add numbers based on multiple criteria. Whether you’re analyzing sales data by region or calculating expenses within specific categories, these functions are indispensable.
Example: To sum sales where the region is “East,” the formula would be:
=SUMIF(RegionRange, "East", SalesRange)
. For multiple criteria, use SUMIFS:
=SUMIFS(SalesRange, RegionRange, "East", MonthRange, "January")
.
PIVOT TABLES – Data Visualization Made Easy –Excel Beyond Basics
PIVOT TABLES – Data Visualization Made Easy
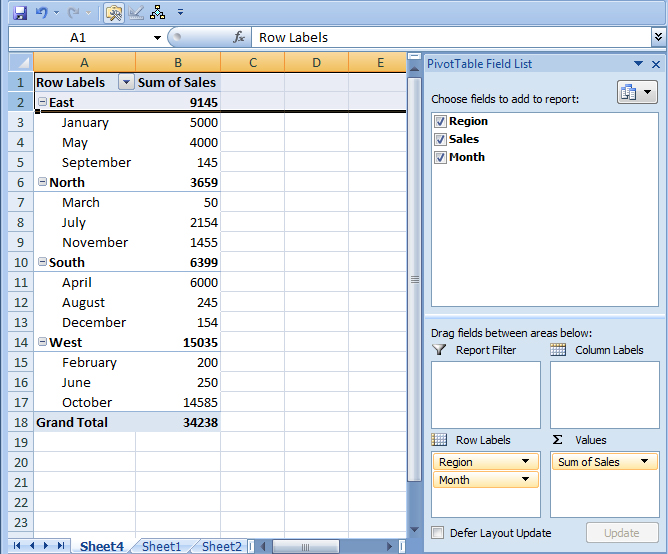
Want to transform raw data into actionable insights? PIVOT TABLES are your go-to tool. They enable you to analyze, summarize, and visualize data with drag-and-drop simplicity. Whether you’re tracking sales trends or analyzing survey responses, PIVOT TABLES present your data in a meaningful way.
Example: Visualizing sales data? Drag “Sales” to values, “Products” to rows, and “Months” to columns. Excel instantly generates a visual representation of your sales data, making trends and patterns easily discernible.
COUNTIF & COUNTIFS – Precise Counting – Excel Beyond Basics
COUNTIF & COUNTIFS – Precise Counting
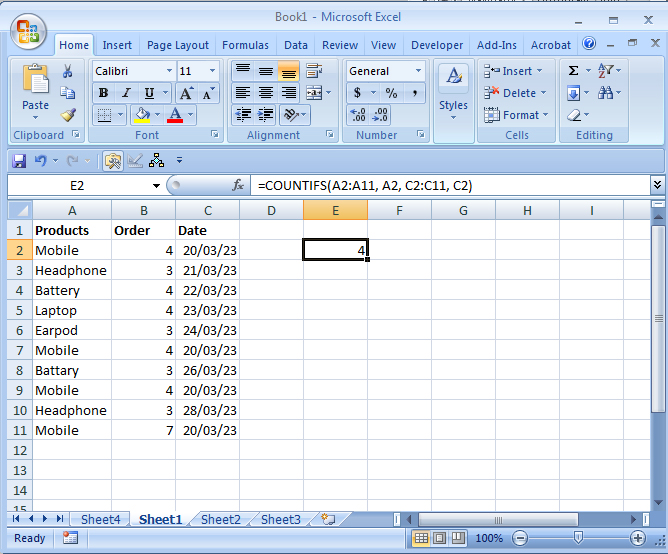
When precision in counting is paramount, COUNTIF and COUNTIFS step in. COUNTIF counts cells based on a single condition, whereas COUNTIFS extends this capability to multiple criteria. Whether you’re tracking customer orders or survey responses, these functions provide accurate counts tailored to your needs.
Example: To count orders where the product is “WidgetX,” the formula would be:
=COUNTIF(ProductRange, "Mobile")
. For multiple criteria, use COUNTIFS:
=COUNTIFS(ProductRange, "Mobile", DateRange, "20/03/23")
.
ARRAY FORMULAS – Supercharged Calculations – Excel Beyond Basics
Bold Heading: ARRAY FORMULAS – Supercharged Calculations
Step into the realm of supercharged calculations with ARRAY FORMULAS. These powerful formulas process multiple pieces of data simultaneously, enabling intricate calculations that would otherwise be daunting. They are your secret weapon for handling large datasets with finesse.
Example: Need to sum values in two columns (B2:B100 and C2:C100)? The formula would be:
{=SUM(B2:B100+C2:C100)}
. Excel processes both columns simultaneously, delivering a total sum.
Conclusion: Unleashing Your Excel Potential
Congratulations! You’ve ventured into the advanced realms of Excel, equipped with functions that elevate your data management and analysis game. Armed with COUNTIF, INDEX & MATCH, PIVOT TABLES, CONCATENATE, and ARRAY FORMULAS, you’re not just handling data; you’re crafting insights, making informed decisions, and mastering the art of Excel.
FAQs: Addressing Your Excel Curiosities
Q1: How does COUNTIF work, and in what scenarios is it useful?
Answer: COUNTIF counts cells within a specified range based on a given condition. It’s useful for tasks like counting specific items, unique entries, or occurrences meeting specific criteria.
Q2: What are the benefits of using INDEX & MATCH over VLOOKUP?
Answer: INDEX & MATCH offer flexibility and adaptability. Unlike VLOOKUP, they can search vertically and horizontally, making them ideal for dynamic data retrieval, especially in shifting or growing datasets.
Q3: How can PIVOT TABLES enhance data analysis?
Answer: PIVOT TABLES summarize and visualize data, allowing you to spot trends, patterns, and outliers. They enable dynamic reorganization of data, making complex information easily digestible.
Q4: What advanced applications does CONCATENATE have?
Answer: CONCATENATE goes beyond merging text. It’s useful for creating custom messages, generating complex codes, and dynamically formatting text based on various conditions.
Q5: When should I use ARRAY FORMULAS in Excel?
Answer: ARRAY FORMULAS are ideal for complex calculations involving large datasets. Use them when you need to process multiple data points at once, simplifying intricate calculations.